GDP is the size of your economy, measured in dollars a year. Tax revenue is a share of it and debt is measured against it, so most of what you can afford follows from it. The simulation moves it once a month and keeps a line-by-line record of why.
Where to find it
- Top bar. GDP, with last month’s change beside it. Hover over it for the projected change next month.
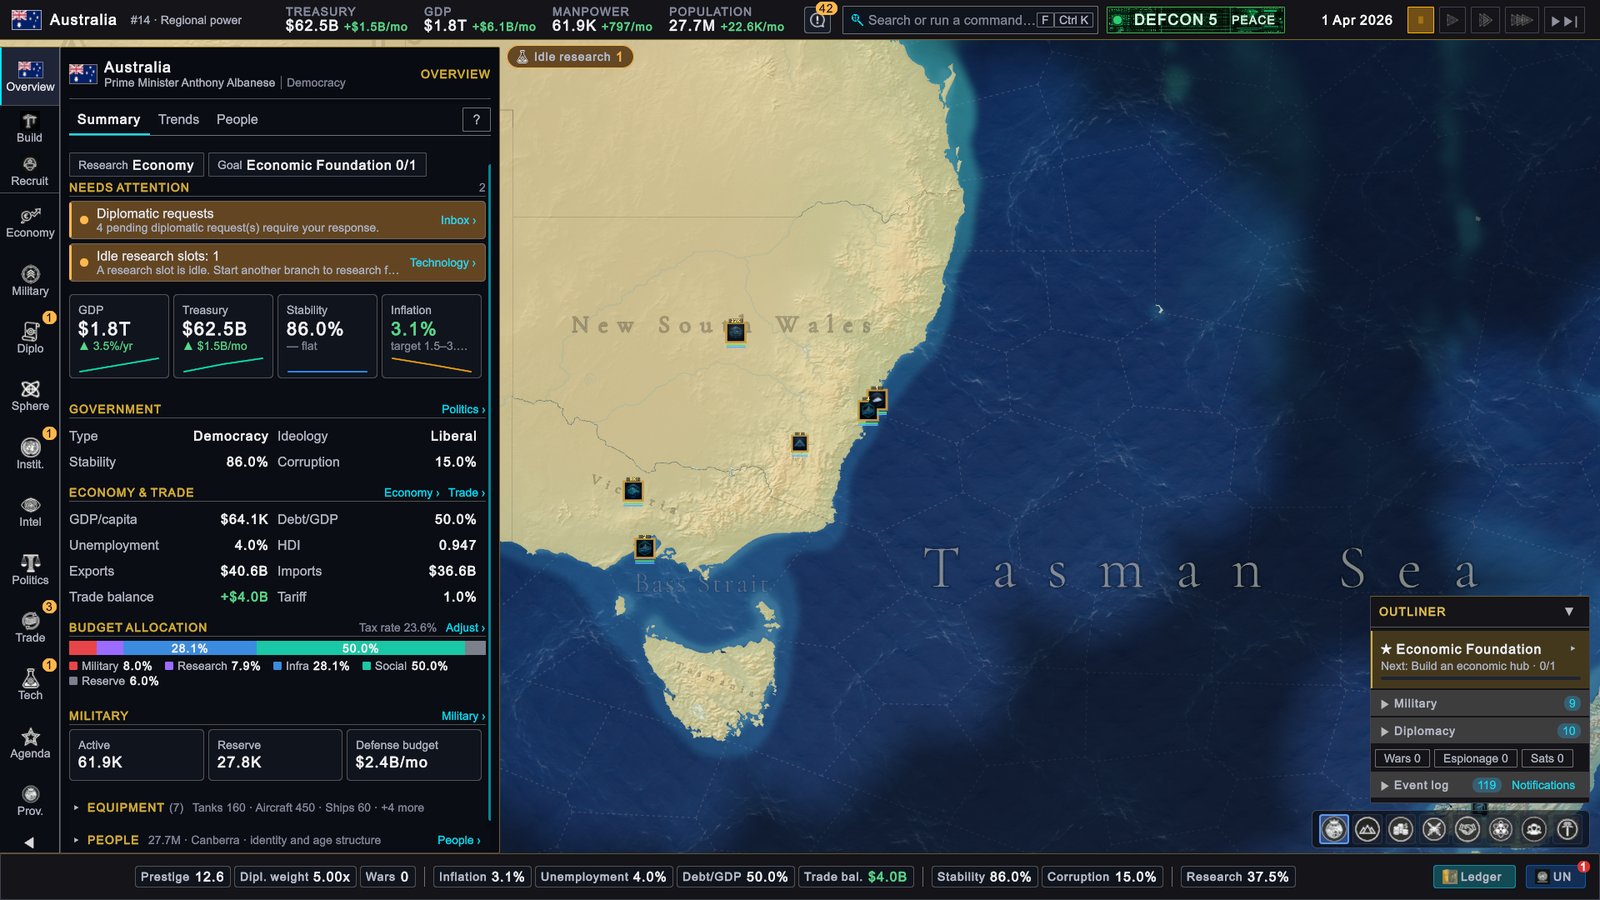
- Overview › Summary. Click Overview on the rail (O by default). The GDP tile shows the figure and the growth rate per year. Click the tile to open the GDP change last month drawer.
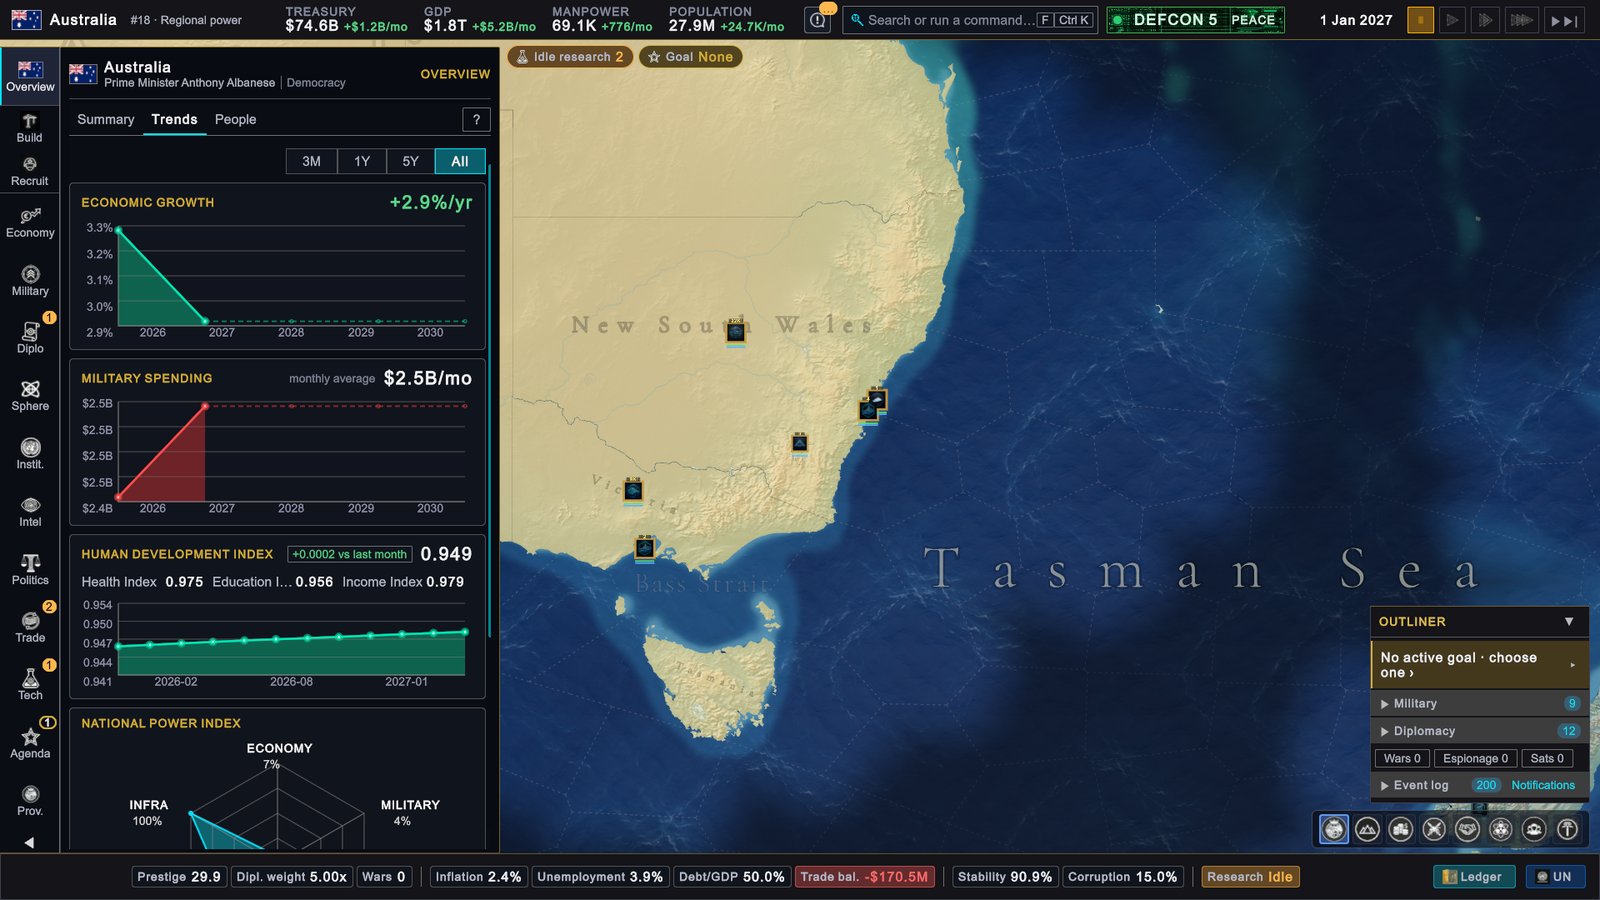
- Overview › Trends. The ECONOMIC GROWTH chart, with 3M, 1Y, 5Y and All ranges, above charts for military spending, the Human Development Index and national power.
- Year Review. The review at each year end has an ANNUAL GDP DELTA LEDGER foldout: the growth lines added up over the year.
- Economy map mode (F3 by default) colours each province by its GDP.
How it works
One national figure, shared out to provinces
Your country has one GDP figure. At the start of each month it grows by one twelfth of the annual growth rate, and the growth rate is rebuilt from the lines described below.
Each province also has an output of its own. It starts from the province’s base production and is scaled by:
- Infrastructure. Each point adds 0.5% to output.
- Terrain. Urban and coastal provinces produce more than plains; mountains, deserts and tundra produce much less.
- Buildings. Economic buildings add a percentage to the province they stand in.
- Local trouble. Unrest and war devastation each remove up to 80% of output, radiation up to all of it, and a province under naval blockade loses a quarter.
- Supply. Factories that cannot get their inputs run below capacity, which shrinks their part of the province’s output by up to half.
National GDP is shared out among the provinces you control in proportion to that output, so the province figures add up to the national one. An occupied province is credited to the occupier, at half its output.
The link also runs the other way. When your provinces’ output changes, because a building finished, infrastructure grew or unrest fell, part of that change is passed to national GDP as the Resource reconciliation line. That line is normally capped at 0.05% of GDP a month, so buildings and infrastructure move national GDP in small steps. Provinces that change hands move it at once and in full, as Territory change.
The growth rate, line by line
The GDP change last month drawer lists every line in dollars for the last closed month. It is empty until the first month closes. The top rows are totals: Net GDP delta, the positive and negative lines summed, and Province gross sum beside Country net GDP. Hover over a row for a one-line explanation. For another country the drawer opens only when you can see its figures exactly; otherwise the tile takes you to Trends.
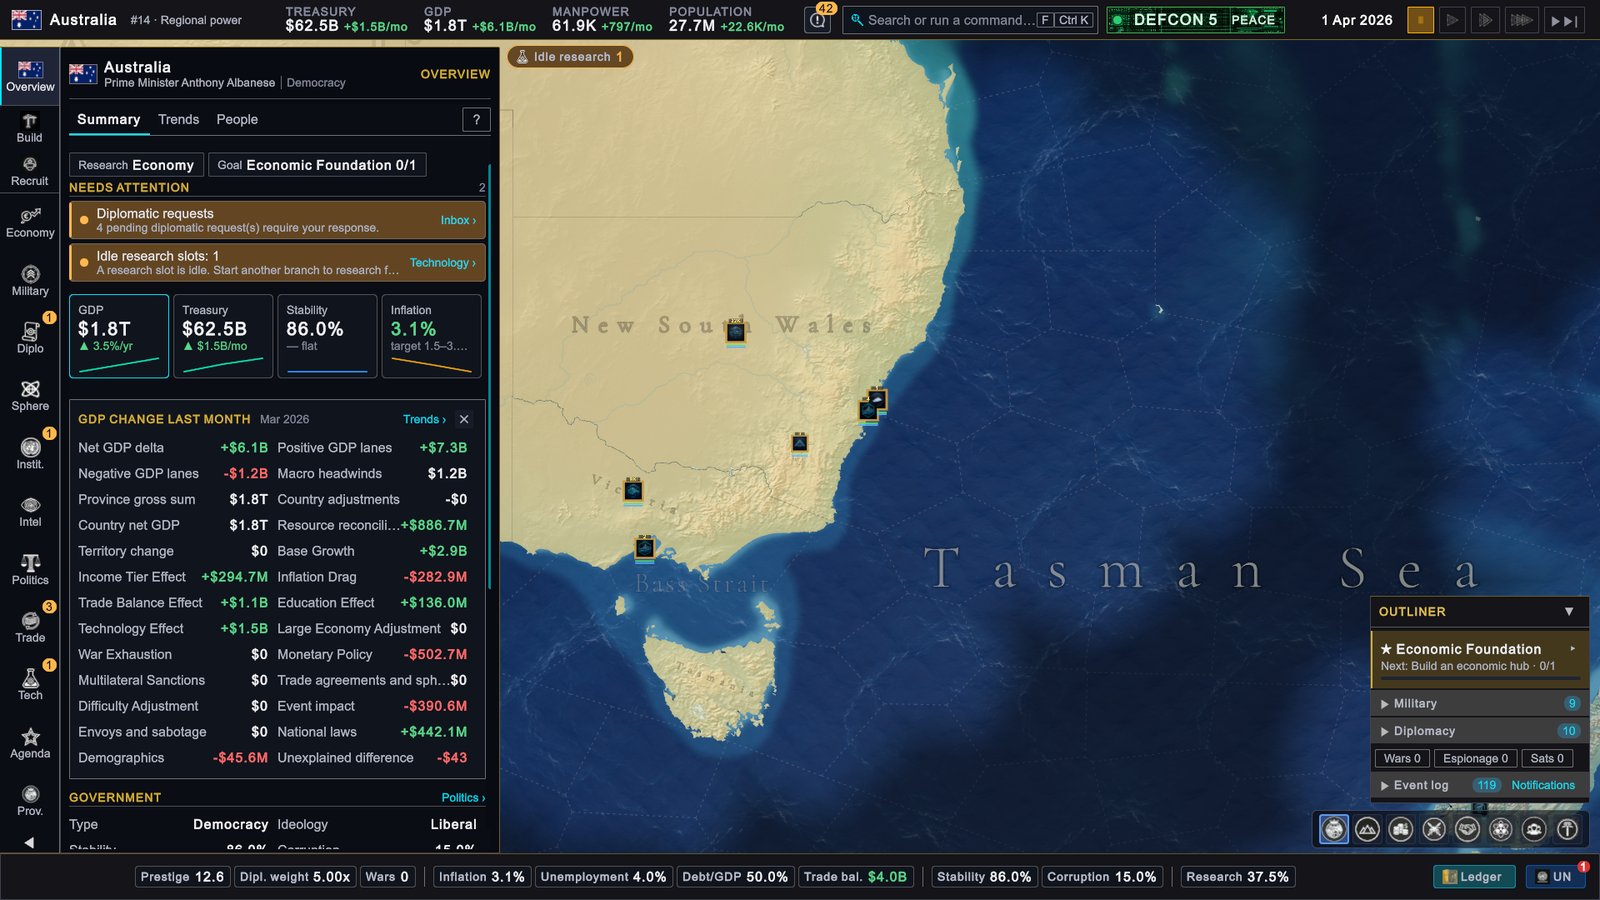
The sizes below are points of annual growth. Each month applies one twelfth.
| Line in the drawer | What it measures | Size |
|---|---|---|
| Base Growth | Every economy gets it | +2.0 |
| Income Tier Effect | Catch-up growth by GDP per capita | +1.4 below $2,500 a head, +0.9 up to $9,000, +0.6 up to $22,000, +0.2 above |
| Inflation Drag | How far inflation is from zero, in either direction | About −0.3 at 5% inflation, −1.1 at 20%, −2.4 at 50% |
| Trade Balance Effect | The year’s trade balance as a share of GDP | Between −0.75 and +0.75 |
| Education Effect | Average education of your population | Up to +0.1 |
| Technology Effect | Growth bonuses from researched doctrines | At most +2.0 |
| Large Economy Adjustment | Scales the six lines above down once GDP passes $10 trillion | About a sixth off at $20 trillion, a quarter at $30 trillion |
| Monetary Policy | The policy rate against the neutral rate, and the policy stance | −0.25 per point above neutral; about a third of that, as a gain, per point below |
| Trade agreements and sphere | Your trade agreements and sphere membership | Capped together |
| Multilateral Sanctions | Sanctions in force against you | A loss |
| Event impact | Event outcomes. The lasting growth bonus fades by about 6% a month | Lasting bonus within ±2.0 |
| National laws | The laws in force | Either way |
| War Exhaustion | War exhaustion from 0 to 100, and nuclear strikes on you | Up to −4.0 at exhaustion 100 |
| Demographics | The share of your people aged 18 to 55, against the world average | Scales the whole rate by up to 10% either way |
| Difficulty Adjustment | The game difficulty, for player countries with positive growth | The lowest setting adds a quarter; the two highest cut about 13% and 23% |
Limits and overheating
- The first six lines of the table are added, scaled down for the largest economies, and held between −15% and +15% a year. The other lines are applied after that.
- Growth feeds inflation. Each month a small share of your growth rate is added to inflation as Demand Pressure: an economy growing 5% a year adds about half a point of inflation over that year. Inflation then pulls growth back through Inflation Drag.
- Growth moves unemployment. When shocks such as inflation, high interest rates, war or sanctions push growth below what the lasting lines would give, unemployment rises; it falls when growth runs above that.
- Unexplained difference, the last row, is whatever the lines do not account for, such as a shock in the middle of a month.
What to do
- Read the drawer before you act. The largest negative row is where a change pays most. Macro headwinds adds the negative rows into one figure.
- Bring inflation down. Inflation Drag grows with every point of inflation. See Inflation and monetary policy.
- Keep the policy rate near neutral once inflation is under control. A rate held above neutral costs growth every month it stays there.
- Run a trade surplus if you can. The effect is capped at three quarters of a point, so it is not worth wrecking your budget for.
- Research doctrines with a growth bonus in the Knowledge Network. Their combined effect stops at 2 points.
- Build infrastructure and economic buildings. They raise province output, and more infrastructure unlocks more building slots. See Buildings and construction.
- Sign trade agreements and pick laws with a growth bonus.
- Keep wars short. War exhaustion alone can take 4 points off growth, and occupied or devastated provinces produce less.
- Expect growth to slow as you get richer. The catch-up bonus shrinks each time GDP per capita crosses into a higher band.